Raspberry Pi Pico W Multi-Display Clock + Sensor Dashboard
This project is a compact multi-display clock and sensor dashboard built around the Raspberry Pi Pico W, featuring four SSD1306 OLED displays and a TCA9548A I²C multiplexer.
The latest version integrates an HLK-LD2401 presence sensor and an onboard AHT20 + BMP280 sensor module, with updated display flows for improved timing and responsiveness.
Early Prototype Demonstration
The video below shows an earlier revision of the project. The current implementation includes updated hardware (Pico W, HLK-LD2401, AHT20/BMP280) and redesigned display flows for improved timing and responsiveness.
Hardware Platform
- Raspberry Pi Pico W
- TCA9548A I²C multiplexer
- 4 × SSD1306 OLED displays
- HLK-LD2401 human presence sensor
- AHT20 + BMP280 onboard sensor
Project Images
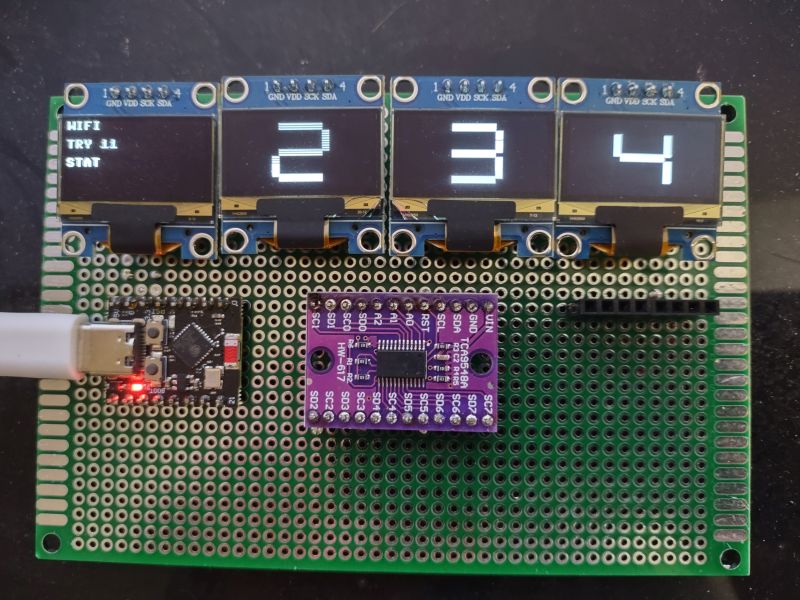
Version 2
Earlier project layout showing the evolving multi-display clock.
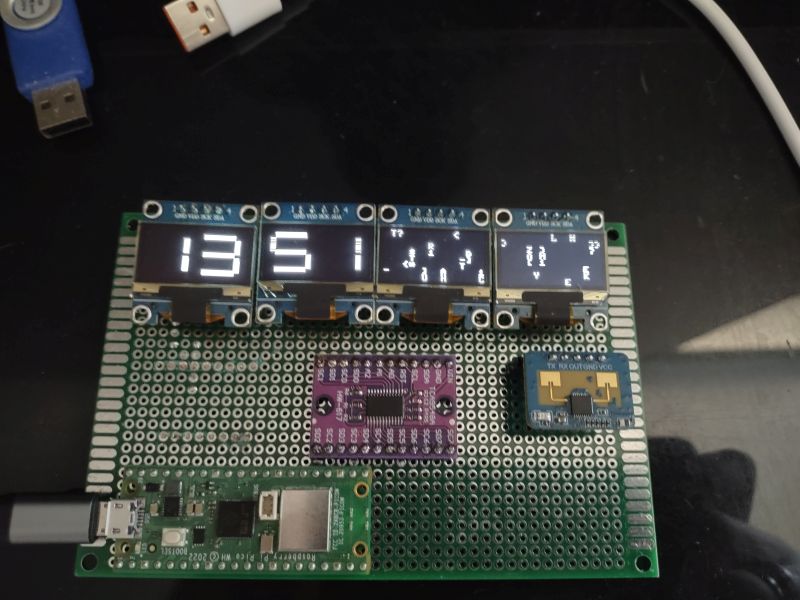
Version 3
Refined layout; ESP32-C3 replaced with Raspberry Pi Pico W.
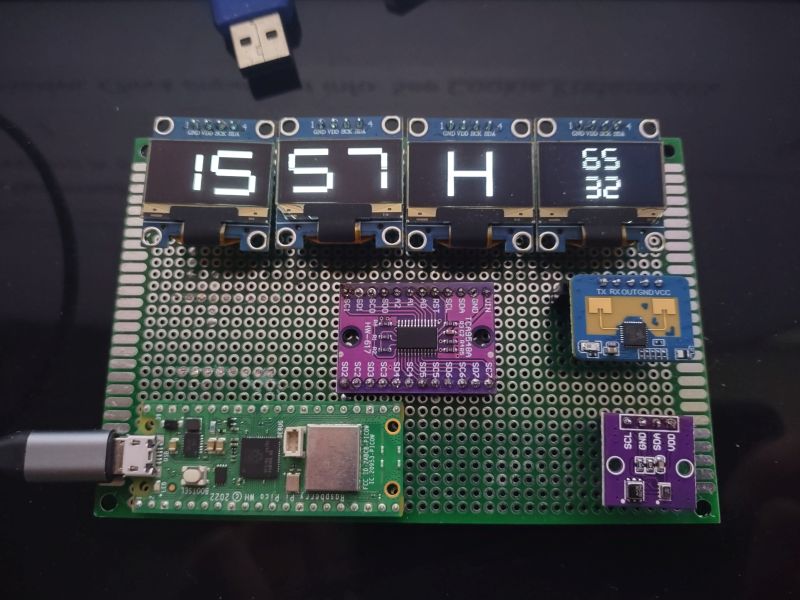
Version 4
Clock and environmental data display.
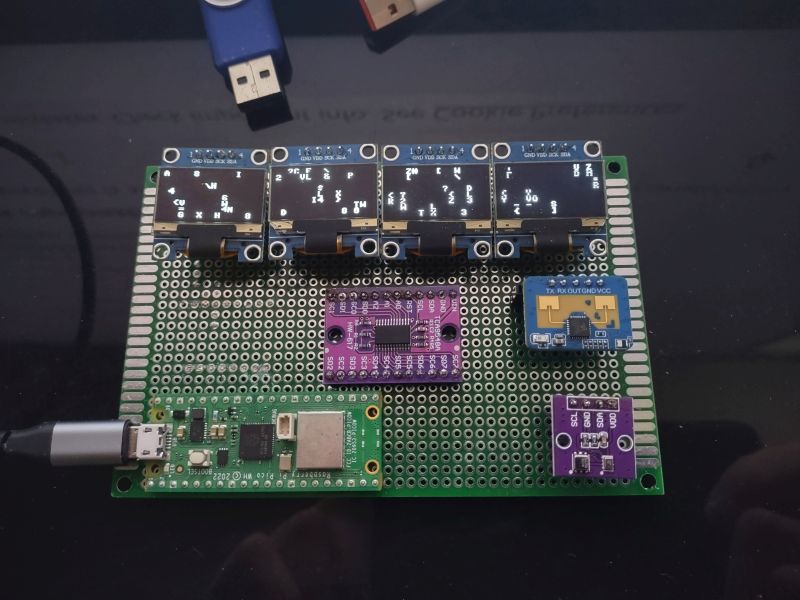
Version 4
Matrix animation effect.
Updated Prototype Demonstration
This video shows the newer prototype with the updated display flow and parallel inside/outside environmental readings.
Current Implementation
This video shows the current version of the project. Displays 3 and 4 present outside and inside environmental readings in parallel, while the HLK-LD2401 presence sensor controls display activation and environmental data presentation. The system also includes automatic day and night operating modes using a photoresistor for ambient light detection, with a configuration-based fallback option for installations without a light sensor.
Display Logic
- Display 1 → Hours
- Display 2 → Minutes
- Display 3 → Outside T / H / P sensor values
- Display 4 → Inside T / H / P sensor values
Displays 3 and 4 now show sensor values in parallel. Display #3 shows outside temperature, humidity, and pressure. Display #4 shows inside temperature, humidity, and pressure.
Human Presence Flow
- Presence detected or when human approaches by 30cm → new cycle starts immediately
- Displays show clock first, then T/H/P values
- More responsive behavior based on user proximity
System Updates
- ✔ Raspberry Pi Pico W replaces ESP32-C3
- ✔ HLK-LD2401 added
- ✔ AHT20 + BMP280 added
- ✔ Display flow refined
- ✔ Presence-triggered cycles implemented
- ✔ Displays 3 and 4 now show outside and inside T/H/P values in parallel
- ✔ Current implementation video added